Understanding financial statements is crucial for successful stock market investing, and the balance sheet stands as one of the most important documents for evaluating a company's financial health. Whether you're a beginner investor, financial analyst, or business owner, knowing how to read and interpret a balance sheet provides invaluable insights into a company's financial position, stability, and growth potential.
This comprehensive guide will walk you through every component of a balance sheet, explain the fundamental accounting principles behind it, and show you how to use this financial statement to make informed investment decisions. By the end of this article, you'll be able to confidently analyze any company's balance sheet and assess its financial strength.
What is a Balance Sheet?
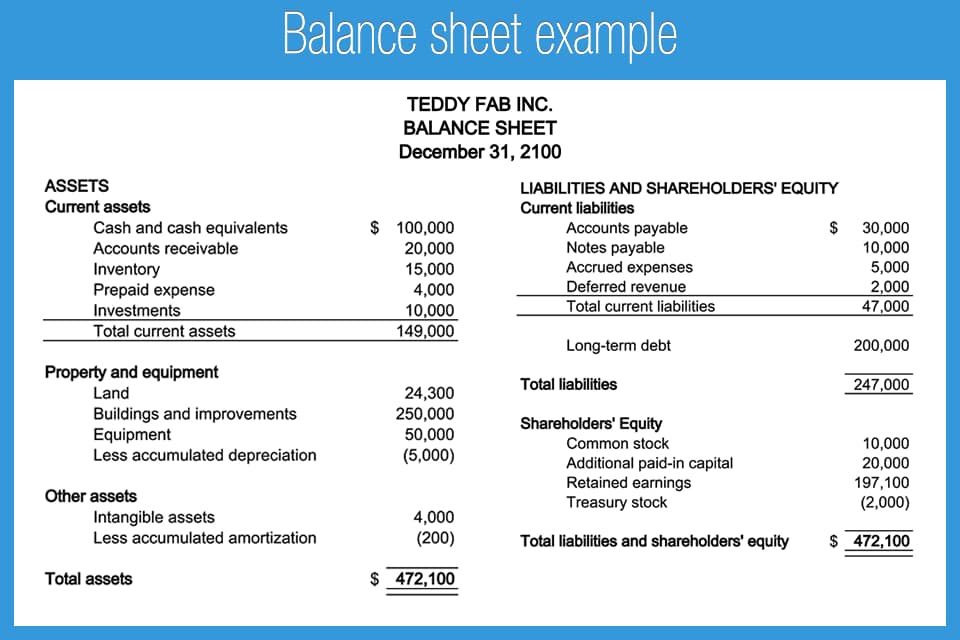
A balance sheet, also known as the statement of financial position, is a financial statement that provides a snapshot of a company's financial condition at a specific point in time. Unlike the income statement which shows performance over a period, the balance sheet captures what a company owns and owes at a particular moment, typically at the end of a fiscal quarter or year.
The balance sheet derives its name from a fundamental accounting principle: it must always balance. This balance is achieved through the accounting equation, which is the cornerstone of double-entry bookkeeping and financial reporting worldwide.
The Fundamental Accounting Equation
This equation must always hold true. Everything a company owns (assets) is financed either through borrowing (liabilities) or owner investment (equity).
This equation tells us that everything a company owns has been funded either through borrowed money (liabilities) or through investments from owners (equity). According to recent financial data from 2025-2026, major corporations like BCE Inc. reported total assets of $68.9 billion balanced against their combined liabilities and shareholders' equity of the same amount, demonstrating this fundamental principle in action.
The Three Core Components of a Balance Sheet
Every balance sheet is organized into three main sections, each providing critical information about different aspects of a company's financial position. Let's examine each component in detail with real-world examples and current data.
1. Assets: What the Company Owns
Assets represent everything of value that a company owns or controls. These resources are expected to provide future economic benefits to the business. Assets are divided into two primary categories based on how quickly they can be converted to cash.
Current Assets (Short-Term Assets)
Current assets are resources that a company expects to convert to cash, sell, or consume within one year or one operating cycle, whichever is longer. These are the most liquid assets and are crucial for day-to-day operations.
Key components of current assets include:
- Cash and Cash Equivalents: This is the most liquid asset category, including physical cash, bank account balances, and short-term investments that mature within 3 months such as money market funds and treasury bills. Companies maintain cash reserves to meet immediate obligations and operational needs.
- Marketable Securities: Short-term investments that can be quickly converted to cash, typically including stocks, bonds, and government securities with maturities between 3-12 months. Major corporations often invest excess cash in these instruments to earn returns while maintaining liquidity.
- Accounts Receivable: Money owed to the company by customers for goods or services already delivered but not yet paid for. For example, if Tata Steel sells steel to a construction company with 60-day payment terms, that outstanding amount appears as accounts receivable. Companies must carefully monitor these amounts and assess collectibility.
- Inventory: For manufacturing and retail companies, inventory includes raw materials, work-in-progress, and finished goods ready for sale. Maruti Suzuki, for instance, would show completed vehicles, parts in assembly, and raw materials like steel and plastic in this category. High inventory levels might signal strong expected demand or potential overproduction issues.
- Prepaid Expenses: Payments made in advance for services or goods to be received in the future, such as insurance premiums, rent, or annual subscriptions. These are assets because they represent value that will be realized within the year.
Non-Current Assets (Long-Term Assets)
Non-current assets are resources that a company plans to use for more than one year. These assets support long-term operations and growth strategies.
Key components of non-current assets include:
- Property, Plant, and Equipment (PP&E): Physical assets used in operations, including land, buildings, machinery, vehicles, and equipment. These are shown at their cost minus accumulated depreciation. For example, an automotive manufacturer's production facilities would be classified here.
- Intangible Assets: Non-physical assets that provide value, including patents, trademarks, copyrights, brand names, and goodwill from acquisitions. Technology companies often have significant intangible assets on their balance sheets.
- Long-Term Investments: Investments in other companies' stocks or bonds that the company intends to hold for more than one year, as well as investments in subsidiaries and joint ventures.
- Deferred Tax Assets: Tax benefits that can be used in future periods, typically arising from temporary differences between accounting income and taxable income.
- Long-Term Receivables: Amounts owed to the company that won't be collected within the next year, such as long-term loans to employees or subsidiaries.
2. Liabilities: What the Company Owes
Liabilities represent the company's obligations or debts to external parties that must be settled in the future. Like assets, liabilities are classified based on when they must be paid.
Current Liabilities (Short-Term Obligations)
Current liabilities are obligations that must be settled within one year or one operating cycle. These represent the company's short-term financial commitments.
Key components of current liabilities include:
- Accounts Payable: Money the company owes to suppliers and vendors for goods and services received but not yet paid for. This is essentially the opposite of accounts receivable.
- Short-Term Debt: Loans and borrowings that must be repaid within one year, including the current portion of long-term debt (the amount due in the next 12 months).
- Accrued Expenses: Expenses that have been incurred but not yet paid, such as wages payable, interest payable, and utilities payable.
- Deferred Revenue: Money received from customers in advance for goods or services that haven't been delivered yet. This is a liability because the company has an obligation to provide the product or service in the future.
- Commercial Paper: Short-term unsecured promissory notes issued by large corporations to raise working capital. For instance, BCE Inc. reported $6 billion in commercial paper as of 2025.
Non-Current Liabilities (Long-Term Obligations)
Non-current liabilities are obligations that are due in more than one year. These represent the company's long-term financing structure.
Key components of non-current liabilities include:
- Long-Term Debt: Loans, bonds, and other borrowings that don't need to be repaid within the next year. This is a major component for many corporations. BCE Inc., for example, reported long-term debt of $118.7 billion in their 2025 financial statements.
- Deferred Tax Liabilities: Taxes that have been calculated but won't be paid until future periods, typically arising from timing differences in recognizing income and expenses.
- Pension Obligations: Long-term commitments to provide pension benefits to employees after retirement.
- Long-Term Lease Obligations: Financial obligations from long-term lease agreements for property, equipment, or other assets.
3. Shareholders' Equity: The Owners' Stake
Shareholders' equity, also called stockholders' equity or owners' equity, represents the residual interest in the company's assets after deducting liabilities. In simple terms, it's what would be left for shareholders if the company sold all its assets and paid off all its debts. You can think of equity as the book value or net worth of the company.
Equity Calculation
This rearrangement of the accounting equation shows that equity represents the owners' claim on company assets.
Key components of shareholders' equity include:
- Share Capital (Common Stock): The par or stated value of shares issued to shareholders. This is calculated as the number of shares outstanding multiplied by the face value per share. This represents the initial capital invested by shareholders when the company issued stock.
- Additional Paid-In Capital (APIC): The amount shareholders paid above the par value of the stock. For example, if a company issues shares with a $1 par value but sells them for $25, the additional $24 per share goes into APIC.
- Retained Earnings: The cumulative profits that the company has earned over its lifetime and has chosen to reinvest in the business rather than distribute as dividends. This is where the balance sheet and income statement interact directly. The net income from each year's income statement flows into retained earnings on the balance sheet. For example, if a company earns $1 million in net income and pays $300,000 in dividends, the remaining $700,000 is added to retained earnings.
- Treasury Stock: Shares that were previously outstanding but have been bought back by the company. These reduce total equity and are shown as a negative number.
- Other Comprehensive Income: Gains or losses that haven't been realized yet, such as foreign currency translation adjustments or unrealized gains on certain investments.
Real-World Balance Sheet Example: Current Data Analysis
To understand how these concepts work in practice, let's examine real balance sheet data from major corporations in 2025-2026. The following table shows simplified balance sheet information from a major technology company (amounts in millions):
| Balance Sheet Item | 2025 Amount ($M) | 2024 Amount ($M) | Change (%) |
|---|---|---|---|
| Current Assets | |||
| Cash and Cash Equivalents | $190,516 | $191,830 | -0.7% |
| Accounts Receivable, net | $26,278 | $16,120 | +63.0% |
| Inventories | $6,580 | $4,061 | +62.0% |
| Other Current Assets | $39,339 | $32,589 | +20.7% |
| Total Current Assets | $262,713 | $244,600 | +7.4% |
| Non-Current Assets | |||
| Property, Plant & Equipment, net | $39,440 | $36,766 | +7.3% |
| Other Non-Current Assets | $48,849 | $42,522 | +14.9% |
| Total Assets | $351,002 | $323,888 | +8.4% |
| Current Liabilities | |||
| Accounts Payable | $54,763 | $42,296 | +29.5% |
| Other Current Liabilities | $61,105 | $54,323 | +12.5% |
| Total Current Liabilities | $115,868 | $96,619 | +19.9% |
| Non-Current Liabilities | |||
| Long-Term Debt | $118,719 | $107,440 | +10.5% |
| Other Non-Current Liabilities | $53,325 | $54,490 | -2.1% |
| Total Liabilities | $287,912 | $258,549 | +11.4% |
| Shareholders' Equity | $63,090 | $65,339 | -3.4% |
| Total Liabilities + Equity | $351,002 | $323,888 | +8.4% |
This real-world example demonstrates several important observations about the company's financial health and strategic decisions during the 2024-2025 period. Notice how total assets exactly equal total liabilities plus shareholders' equity in both years, confirming the fundamental accounting equation.
Key Financial Ratios Derived from the Balance Sheet
The balance sheet is not just a list of numbers—it's a powerful tool for calculating financial ratios that reveal insights about a company's liquidity, leverage, and efficiency. These ratios are essential for comparing companies and assessing financial health.
Liquidity Ratios: Measuring Short-Term Financial Health
Liquidity ratios assess a company's ability to meet its short-term obligations using its short-term assets. These ratios are crucial for understanding whether a company has sufficient working capital to continue operations.
1. Current Ratio
The current ratio is the simplest and most commonly used liquidity measure. It shows how many dollars of current assets are available to cover each dollar of current liabilities. Using our example data: $262,713 ÷ $115,868 = 2.27
A ratio above 1.0 indicates that the company has more current assets than current liabilities, which is generally positive. Most analysts look for a current ratio between 1.5 and 3.0 as ideal. A ratio of 2.27 suggests strong short-term financial health. However, an extremely high ratio might indicate inefficient use of assets.
2. Quick Ratio (Acid Test Ratio)
The quick ratio is a more stringent test of liquidity because it excludes inventory and prepaid expenses, which may not be quickly convertible to cash. It focuses on the most liquid assets. Using our example: ($190,516 + $26,278) ÷ $115,868 = 1.87
A quick ratio above 1.0 generally indicates good short-term liquidity. This company's ratio of 1.87 suggests it could cover all current liabilities nearly twice over using only its most liquid assets, which is very healthy. According to 2026 banking regulations, financial institutions are required to maintain liquidity coverage ratios of at least 100% to ensure stability.
3. Cash Ratio
The cash ratio is the most conservative liquidity measure, considering only cash and marketable securities. It represents a "worst-case scenario" test. Using our example: $190,516 ÷ $115,868 = 1.64
While a cash ratio of 1.0 or higher is excellent, most companies operate with lower ratios since holding too much cash can be inefficient. This company's 1.64 ratio indicates exceptional liquidity and financial flexibility.
Leverage Ratios: Understanding Capital Structure
Leverage ratios examine how a company finances its operations and growth—whether through debt (borrowed money) or equity (owner investments). These ratios are critical for assessing financial risk.
1. Debt-to-Equity Ratio
This ratio shows how much debt the company uses relative to equity financing. Using our example: $287,912 ÷ $63,090 = 4.56
A ratio of 4.56 means the company has $4.56 of debt for every $1 of equity. Higher ratios indicate more financial leverage and potentially higher risk, but what's considered "high" varies by industry. Capital-intensive industries like telecommunications typically have higher ratios. For context, BCE Inc. in 2025 had significant leverage reflecting their infrastructure investments.
2. Debt-to-Assets Ratio
This ratio indicates what percentage of the company's assets are financed through debt. Using our example: $287,912 ÷ $351,002 = 0.82 or 82%
This means 82% of the company's assets are financed by debt, with only 18% financed by equity. While this seems high, it's not uncommon in certain industries. Investors should compare this ratio to industry peers and historical trends.
3. Equity Ratio
This shows what percentage of assets are owned outright by shareholders. Using our example: $63,090 ÷ $351,002 = 0.18 or 18%
An equity ratio of 18% means shareholders own less than a fifth of the company's assets outright. The remaining 82% is financed through liabilities. Higher equity ratios generally indicate lower financial risk.
How to Analyze Balance Sheet Trends Over Time
A single balance sheet provides valuable information, but analyzing trends across multiple periods reveals much more about a company's trajectory, management decisions, and financial strategy. Here are key aspects to examine when conducting trend analysis:
Asset Growth Analysis
Examine how total assets have changed over time. Consistent growth in assets often indicates business expansion. However, investigate what's driving the growth—is it from increased cash (strong operations), inventory buildup (potential problems), or acquired assets (acquisitions)?
Debt Trend Monitoring
Track changes in total debt over multiple periods. Increasing debt might indicate expansion financing or financial stress. Compare debt growth to revenue and cash flow growth to assess if debt levels are sustainable.
Working Capital Changes
Calculate working capital (current assets minus current liabilities) each period. Declining working capital might signal liquidity concerns, while growing working capital suggests improving financial flexibility.
Equity Evolution
Monitor changes in retained earnings and total equity. Growing retained earnings indicate profitability and reinvestment, while declining equity might suggest losses or excessive dividend payments.
Common Red Flags to Watch For
When analyzing balance sheets, certain warning signs can indicate potential financial problems. Savvy investors learn to spot these red flags early:
- Declining Cash Balances: Consistent decreases in cash and cash equivalents, especially when accompanied by increasing receivables or inventory, may signal collection problems or slowing sales.
- Rising Accounts Receivable: If accounts receivable grow faster than sales, it might indicate that customers are taking longer to pay or that the company is offering overly generous credit terms to boost sales.
- Inventory Accumulation: Rapid inventory growth relative to sales could mean the company is having trouble selling products, potentially leading to obsolescence or markdowns.
- Deteriorating Liquidity Ratios: If current ratio or quick ratio trends downward over time, the company may be facing increasing difficulty meeting short-term obligations.
- Excessive Leverage: Debt-to-equity ratios that are significantly higher than industry peers or that are increasing rapidly may indicate unsustainable leverage and heightened bankruptcy risk.
- Negative Shareholders' Equity: When liabilities exceed assets, equity becomes negative—a serious warning sign that the company may be insolvent or heavily over-leveraged.
- Large Intangible Assets: Companies with high percentages of intangible assets (especially goodwill from acquisitions) may face impairment charges if those acquisitions don't perform as expected.
Industry-Specific Balance Sheet Considerations
Balance sheets can vary significantly across different industries due to varying business models, capital requirements, and operational characteristics. Understanding these differences is crucial for accurate analysis:
| Industry | Typical Characteristics | Key Balance Sheet Items |
|---|---|---|
| Technology Companies | High cash balances, low physical assets, significant intangibles | Cash, marketable securities, goodwill, intellectual property |
| Manufacturing | High PP&E, significant inventory levels | Property, plant & equipment, raw materials, work-in-progress inventory |
| Retail | Large inventory holdings, accounts payable focus | Inventory, store fixtures, accounts payable to suppliers |
| Financial Services | Primarily financial assets and liabilities, high leverage | Loans receivable, investment securities, customer deposits |
| Telecommunications | Massive infrastructure assets, high debt levels | Network infrastructure, long-term debt, depreciation |
| Real Estate | Property holdings dominate assets, mortgage debt | Investment properties, land, mortgages payable |
For example, a technology company like a software provider might have 60-70% of its assets in cash and intangibles, while a manufacturing company might have 50-60% in property, plant, and equipment. Neither is inherently better—they simply reflect different business models.
Integrating Balance Sheet Analysis with Other Financial Statements
While the balance sheet provides crucial insights, it's most powerful when analyzed alongside the income statement and cash flow statement. These three financial statements are interconnected and tell a complete financial story:
The Interplay Between Financial Statements
Balance Sheet ↔ Income Statement: Net income from the income statement flows into retained earnings on the balance sheet. Dividends paid reduce retained earnings. This connection shows how profitability translates into growing equity.
Balance Sheet ↔ Cash Flow Statement: Changes in balance sheet accounts between periods explain the operating, investing, and financing cash flows. For example, an increase in accounts receivable reduces operating cash flow, while an increase in long-term debt appears as financing cash inflow.
Comprehensive Analysis: The balance sheet shows financial position at a point in time, the income statement shows profitability over a period, and the cash flow statement shows actual cash movements. Together, they provide a complete picture of financial health and performance.
For instance, a company might show strong net income on the income statement but have cash flow problems visible in declining cash on the balance sheet. This discrepancy could indicate aggressive revenue recognition or difficulty collecting receivables—insights you'd miss by looking at just one statement.
Practical Steps for Balance Sheet Analysis
To effectively analyze any company's balance sheet for investment or business evaluation purposes, follow this systematic approach:
- Obtain Recent Balance Sheets: Access the company's most recent quarterly (10-Q) and annual (10-K) reports from the SEC's EDGAR database or the company's investor relations website. Get at least 3-5 years of annual data for trend analysis.
- Verify the Accounting Equation: Confirm that Assets = Liabilities + Shareholders' Equity. This basic check ensures the balance sheet is properly constructed.
- Calculate Key Ratios: Compute liquidity ratios (current ratio, quick ratio), leverage ratios (debt-to-equity, debt-to-assets), and efficiency ratios. Compare these to industry benchmarks and competitors.
- Analyze Asset Composition: Determine what percentage of assets are current vs. non-current, tangible vs. intangible. Assess whether the composition makes sense for the industry and business model.
- Examine Liability Structure: Look at the maturity schedule of debt obligations. Does the company have major debt coming due soon? Can it refinance or pay it off with current assets or expected cash flows?
- Review Equity Changes: Track changes in retained earnings, share buybacks (treasury stock), and any equity issuances. Are earnings being reinvested effectively or distributed to shareholders?
- Conduct Trend Analysis: Compare balance sheets across multiple periods. Look for concerning trends like declining cash, increasing leverage, or deteriorating liquidity.
- Industry Comparison: Compare the company's balance sheet metrics to industry averages and direct competitors. Identify where the company is stronger or weaker than peers.
- Read the Footnotes: Balance sheet footnotes contain critical information about accounting policies, debt covenants, contingent liabilities, and potential risks not obvious in the main statement.
- Integrate with Other Statements: Cross-reference with the income statement and cash flow statement to understand the complete financial picture and reconcile any apparent discrepancies.
2026 Balance Sheet Considerations and Emerging Trends
As we move through 2026, several emerging trends and considerations are particularly relevant for balance sheet analysis in the current economic environment:
Rising Interest Rate Environment
With interest rates at elevated levels, companies with high debt loads face increased interest expenses. Analyze how refinancing needs and higher borrowing costs might impact future financial flexibility.
Integrated Balance Sheet Planning
According to 2025-2026 financial trends, leading companies are moving beyond traditional accounting-based planning to embrace detailed cash flow-based balance sheet planning for better optimization and risk management.
Liquidity Requirements
Banking regulations in 2026 require financial institutions to maintain Liquidity Coverage Ratios (LCR) of at least 100% and focus on Net Stable Funding Ratios (NSFR), reflecting increased regulatory emphasis on financial stability.
Digital Asset Recognition
As cryptocurrencies and digital assets gain mainstream acceptance, accounting standards are evolving. Companies holding significant digital assets must disclose them appropriately on balance sheets.
Conclusion: Mastering Balance Sheet Analysis
Understanding how to read and analyze a balance sheet is an essential skill for anyone involved in investing, business management, or financial analysis. This powerful financial statement provides a comprehensive snapshot of a company's financial position, revealing its assets, obligations, and net worth at a specific point in time.
By mastering the fundamental accounting equation (Assets = Liabilities + Shareholders' Equity), learning to interpret each component, calculating key financial ratios, and conducting trend analysis over time, you can assess a company's liquidity, leverage, and overall financial health with confidence.
Remember that balance sheet analysis is most effective when integrated with income statement and cash flow statement analysis. No single financial statement tells the complete story—it's the combination of all three, along with careful attention to footnotes and industry context, that provides the comprehensive insights necessary for informed decision-making.
As demonstrated by the real 2025-2026 data examples throughout this guide, balance sheets reflect actual business decisions and economic conditions. Whether you're evaluating a potential stock investment, assessing a business partner's financial stability, or managing your own company's finances, the ability to expertly read and interpret balance sheets will serve you throughout your financial journey.
Start practicing with real company balance sheets available through SEC filings or financial websites. The more balance sheets you analyze, the more patterns you'll recognize and the better you'll become at quickly identifying financial strengths, weaknesses, and potential red flags. This skill, combined with fundamental analysis of other financial statements, will significantly enhance your ability to make sound financial and investment decisions.
Continue Your Stock Analysis Education
Ready to take your financial analysis skills to the next level? Explore these comprehensive resources from ApexTicker to deepen your understanding of stock analysis and valuation:
📊 ApexTicker Home
Access comprehensive stock market data, real-time analysis tools, and financial insights to make informed investment decisions.
🔍 Complete Stock Analysis Guide
Master technical and fundamental analysis techniques with our comprehensive guide covering chart patterns, indicators, and valuation methods.
📈 Fundamental Analysis Deep Dive
Learn how to evaluate company financials, analyze competitive advantages, and assess intrinsic value for long-term investment success.
💰 P/E Ratio Valuation Guide
Understand price-to-earnings ratios, earnings multiples, and how to determine if stocks are overvalued or undervalued in current market conditions.